Seg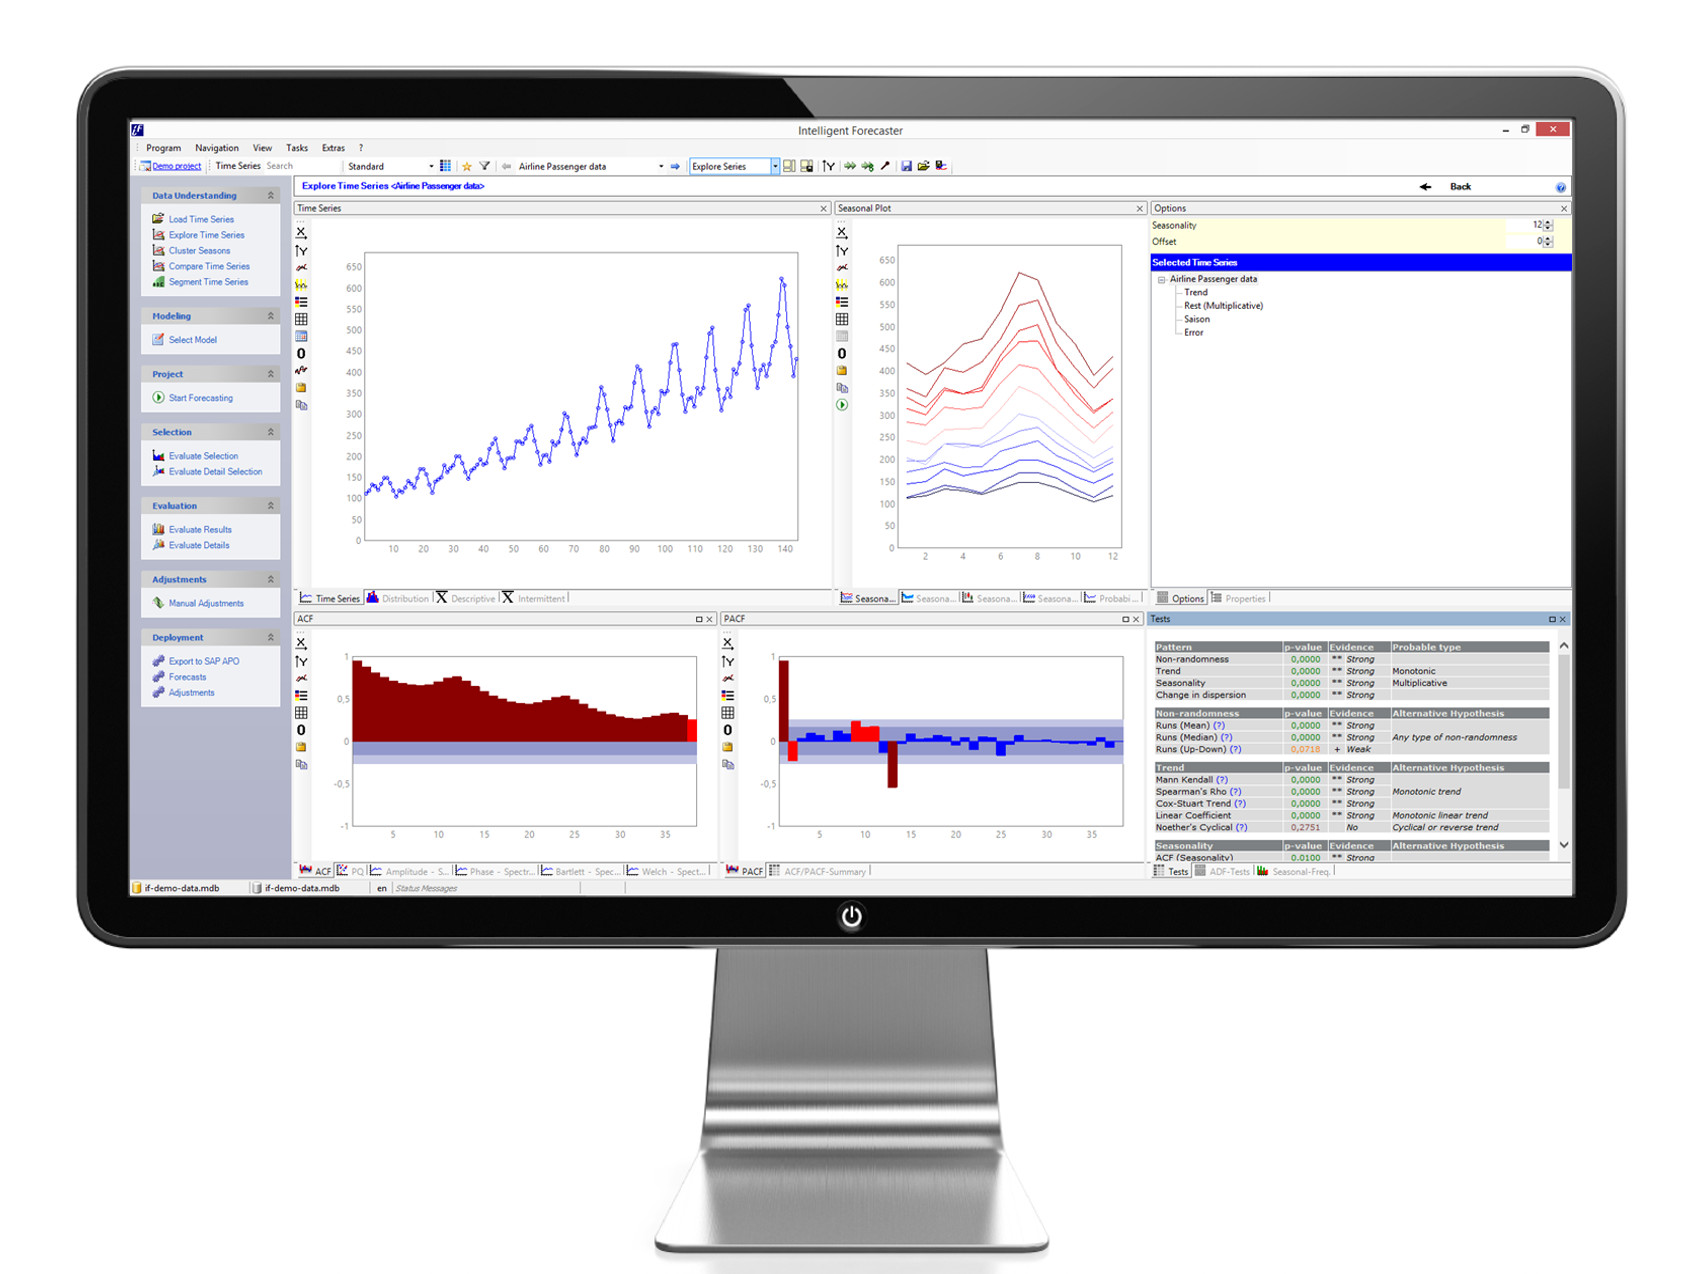 ment by ABC-XYZ
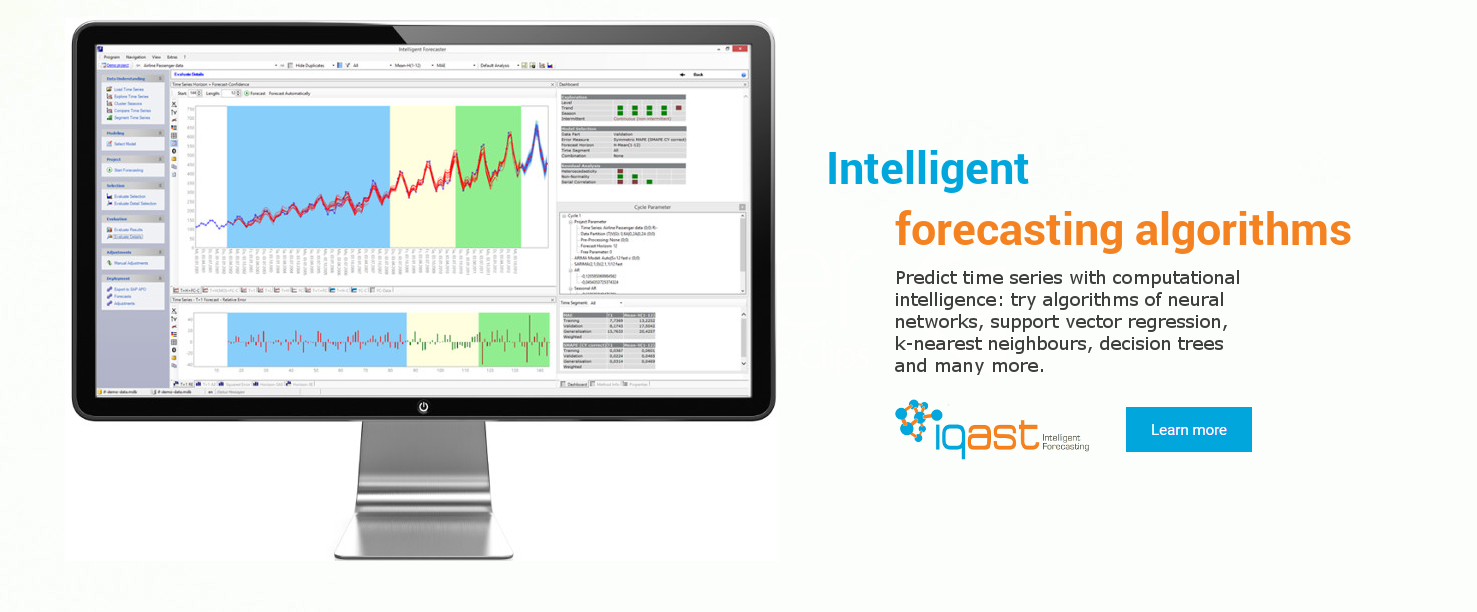
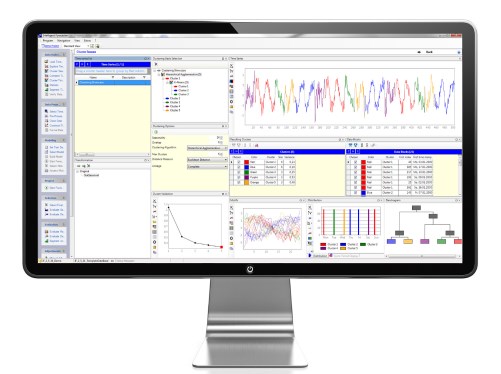
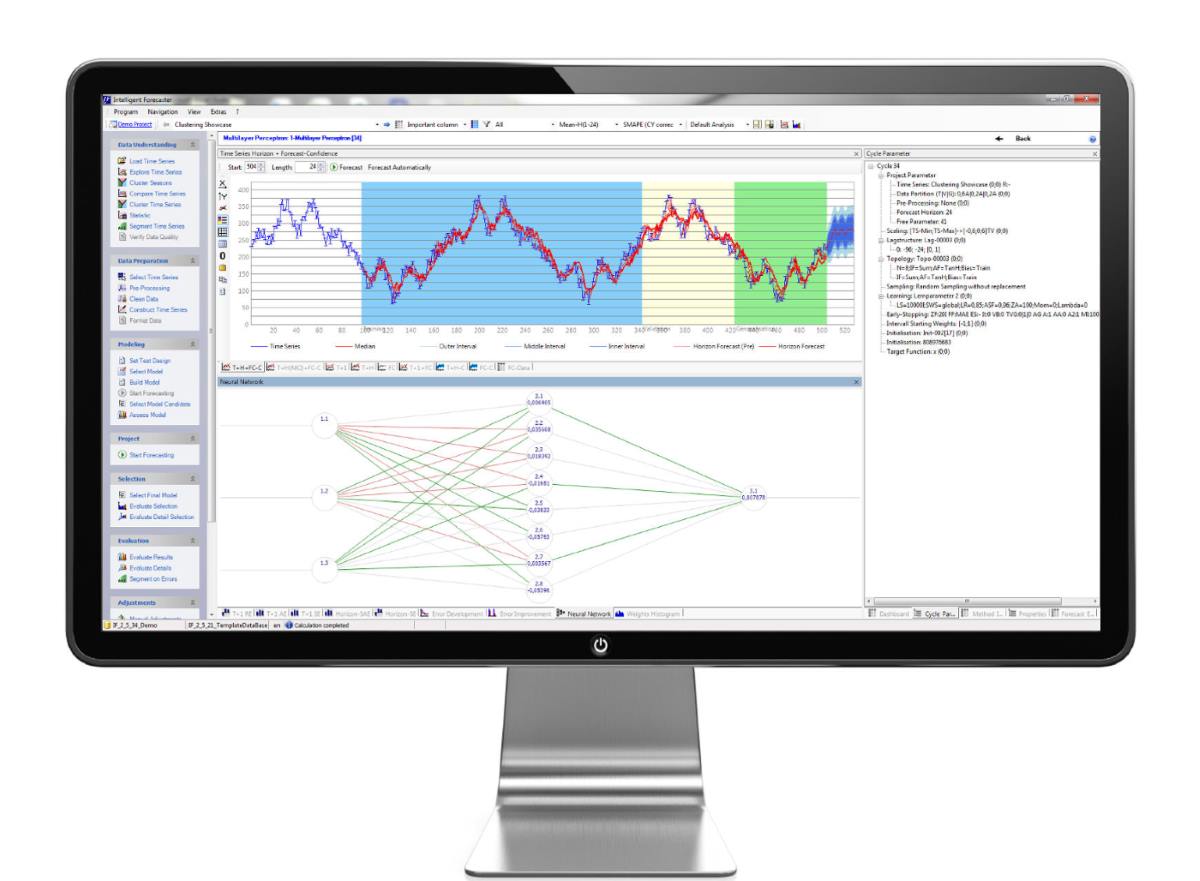
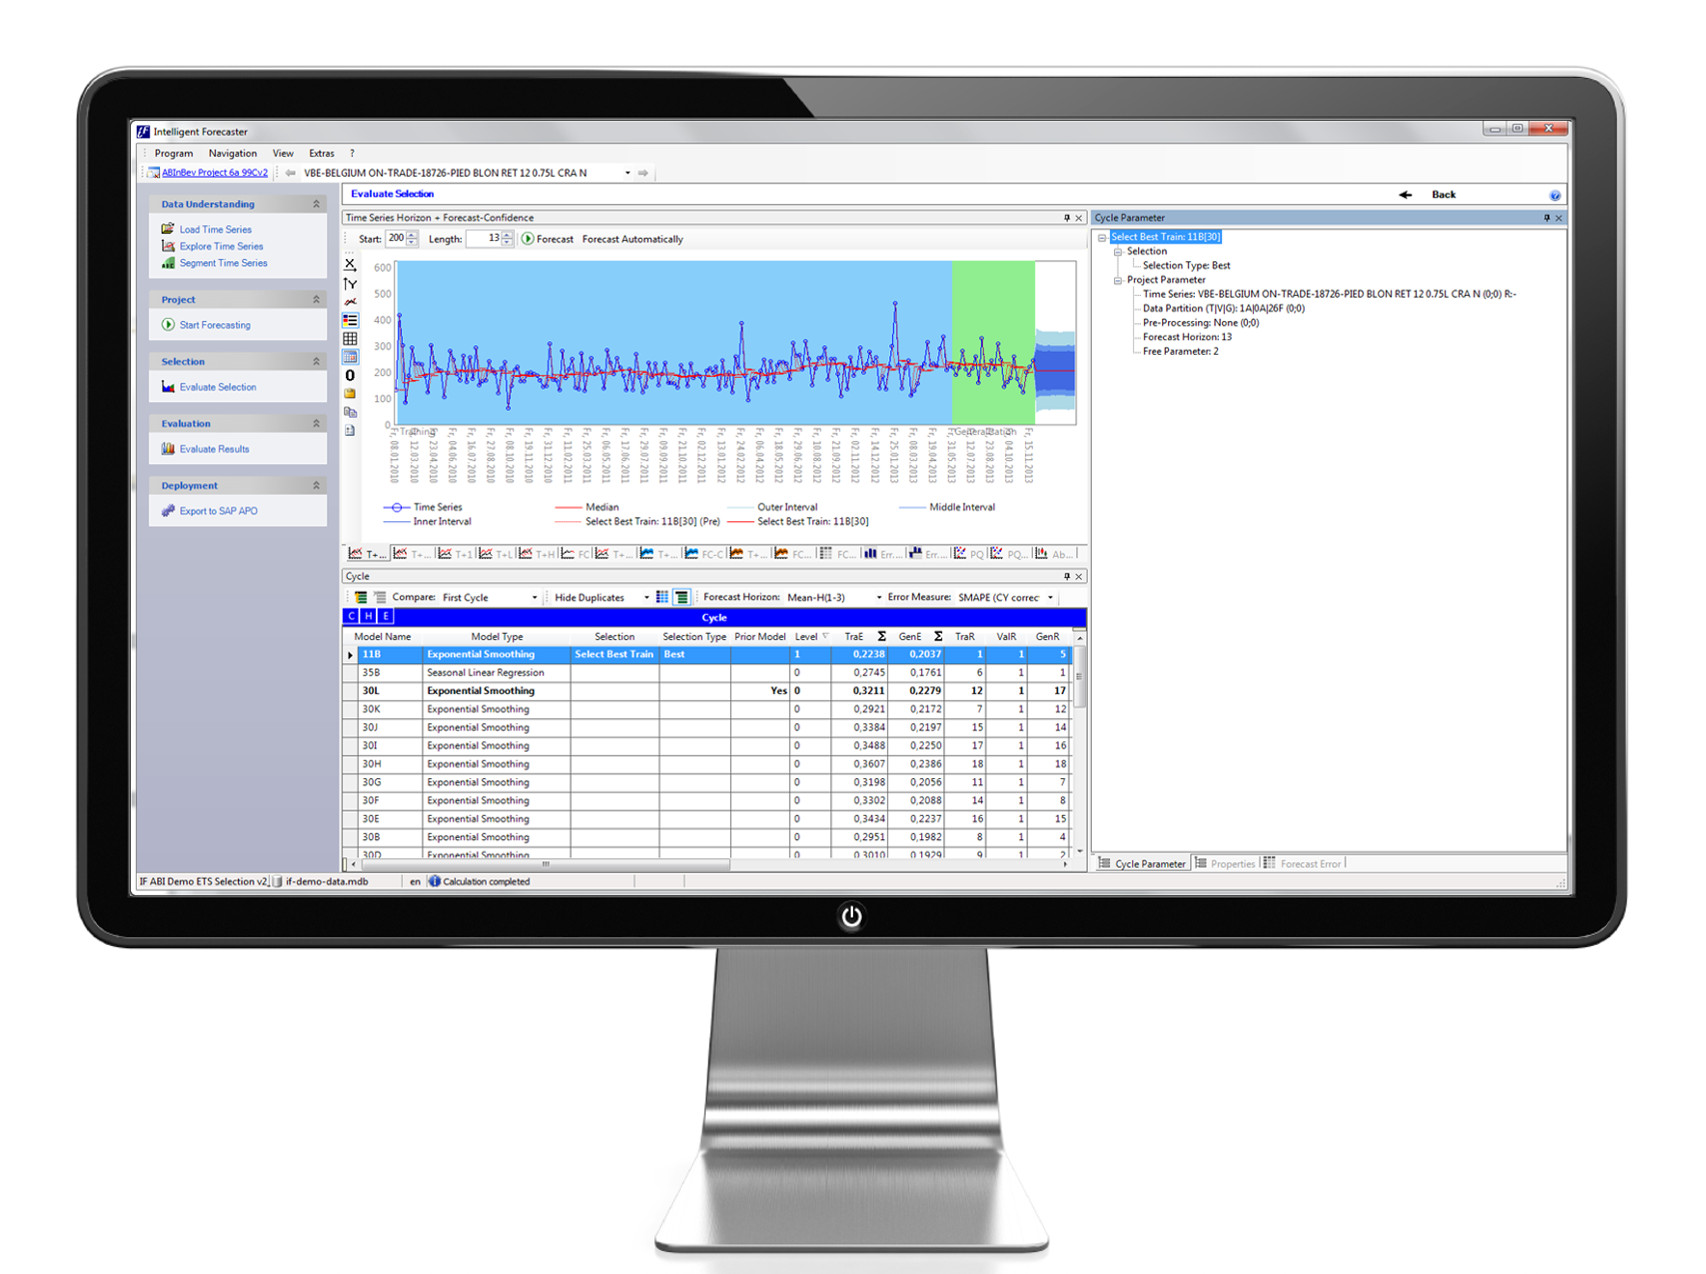
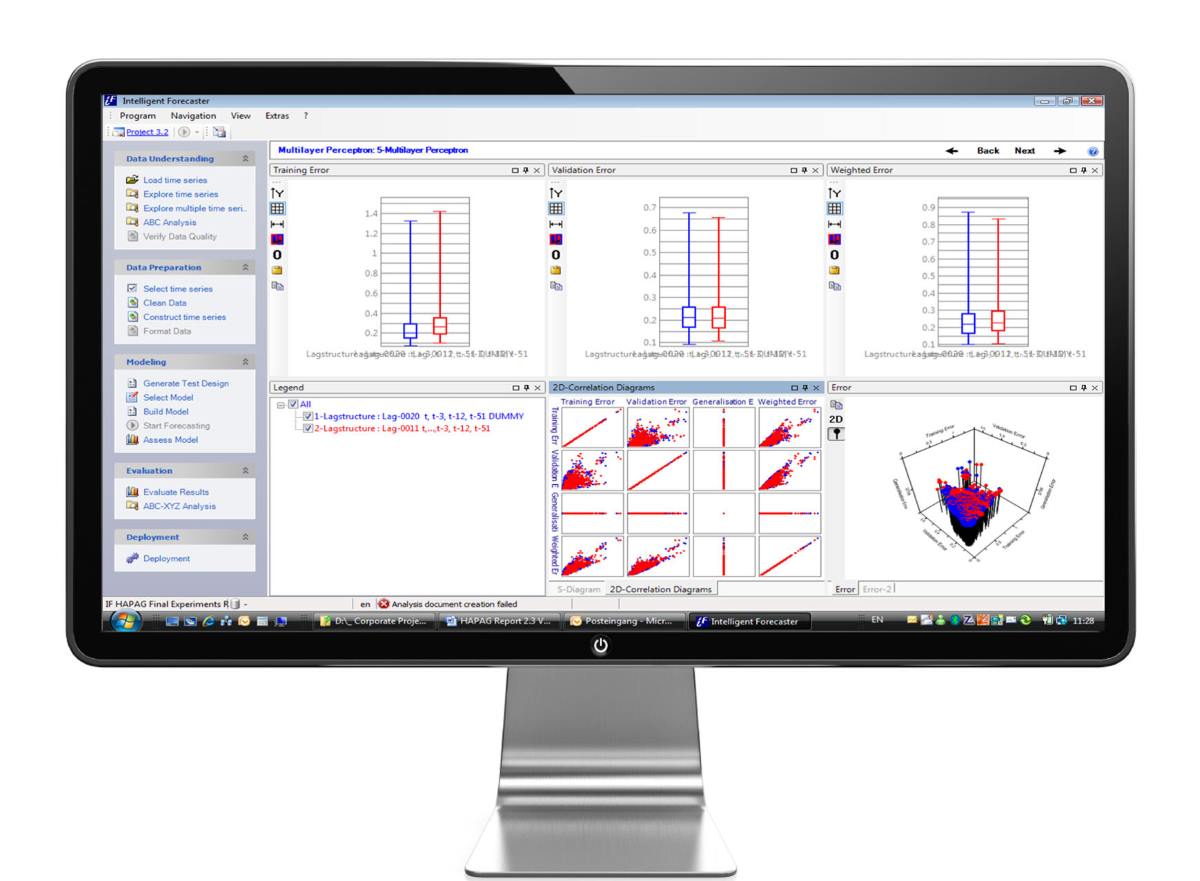
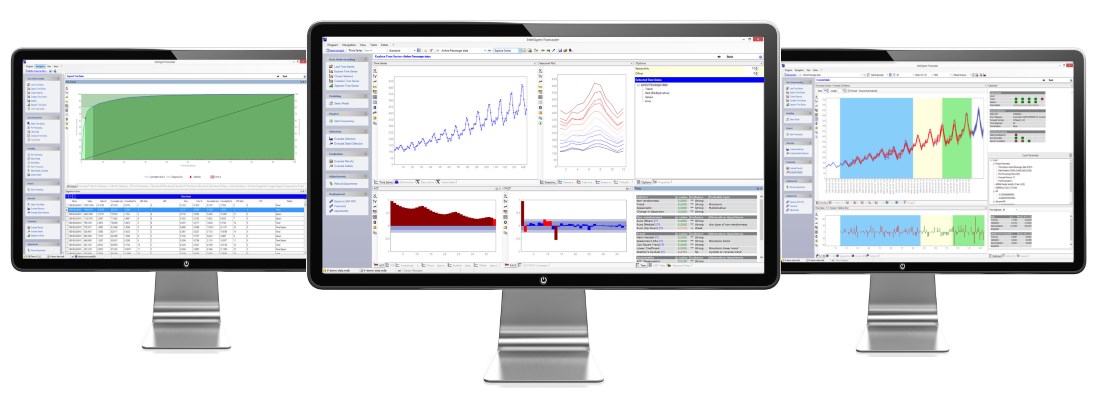
Explore time series data like never before. Visualise all data in plots to understand the data and identify patterns of seasonality, trend, as well as intermittency and outliers. Use rigorous statistical tests to build up confidence in your analysis. Interactively transform the data, de-trend or de-seasonalise or both, remove outliers and missing values, and re-analyse your graphs and tests. iqast® will allow you to find insights fast.

